
The Fertilizer and Food System Fallout of Middle East War
Opinion
Consumer preferences around food are constantly shifting. Over the last 50 years, across the world we have seen a number of different foods fall in and out of favour with consumers. From how we consume certain nutrients, like fat, to which fruit and vegetables are “en vogue”, even to the creation of entirely new categories, such as sports drinks, that we didn’t know we needed!
The dynamic nature of consumer preferences around food illustrates that, as consumers, our choices and preferences are constantly changing, and can shift significantly over the course of a single generation.
In Part 1 “Synthesis Adoption Series: Food History (Part 1): Previous Adoption S-Curves in Food” we discussed specific technological food disruptions; in this second part we will look at how consumers have also changed what they eat.
In Part 1 we discussed the switch in consumption between butter and margarine, a battle which has been waged for over 100 years. But in looking at the broader data around consumption of added fat in the US (using food availability per capita data from the USDA), it becomes clear the story was not so much around butter or margarine but around the huge increase in consumption in “salads and cooking oils” (Exhibit 1).
In total, the added fat per capita in the US has increased by almost 150% in the hundred years since 1910. However, the distribution of how we consume that fat has changed dramatically. In 1910, 50% of added fat came from butter. While the S-curve shows that margarine directly displaced butter from 1910 to 1950, one thing to note is that today (admittedly more than 100 years later!), 65% of the added fat consumed per person in the US comes from “salad and cooking oils”, and less than 10% from butter and margarine. This shows that how the US consumes fat has substantially changed, moving towards more salad dressings and oil-based cooking and baking. (Interestingly when accounting for food loss[i], it is even more with 70% of added fat coming from salad and cooking oils). This is part of a broader switch to plant-based fats over animal fats.
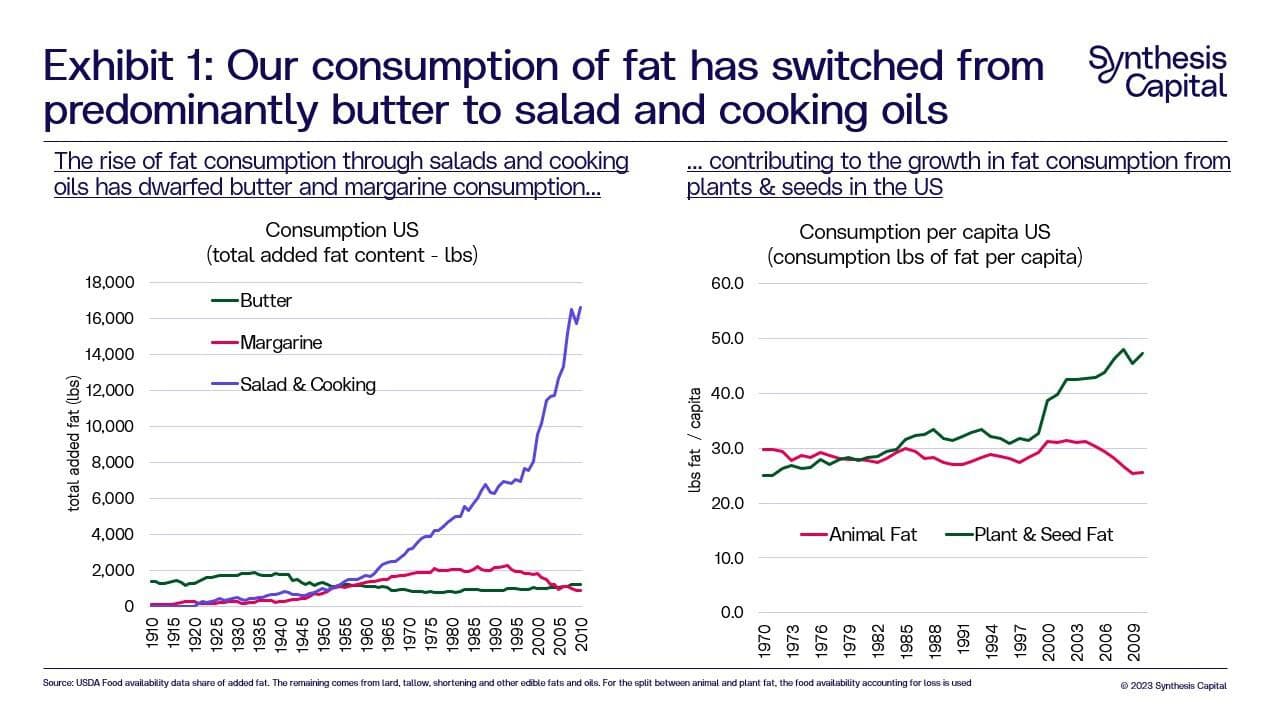
The initial drive to produce and consume more plant oils was cost, as producers sought innovative ways to produce cheap fats and oils, such as Procter and Gamble’s “Crisco” product, a solid fat made from cottonseed oil as an alternative to butter[ii]. Purported health benefits for products like these were aggressively marketed, with health claims on food packaging at the time being unregulated. The success of Crisco opened up the market for widespread production of other cheap vegetable oils, despite little understanding of their health impacts. In addition to the expansion of plant oils in food, the soap and detergent industry underwent a similar change. Proctor and Gamble was also a major player in this application of plant oils: Palmolive is a good example of how soaps were changing at this time, with hard fats from palm oil being mixed with liquid vegetable oils to create a cheap and effective soap[iii].
In the US, 85% of adults will consume some sort of caffeinated beverage daily. While most of this is in the form of coffee, an increasing amount, especially for adolescents and young adults, is being consumed as energy drinks. The growth in caffeinated energy drinks has been meteoric, today accounting for about 10% of caffeine consumption in the US (mostly among the young), with revenues reaching almost $13Bn in 2020 (Exhibit 2). Meanwhile per capita coffee consumption has remained relatively stable.
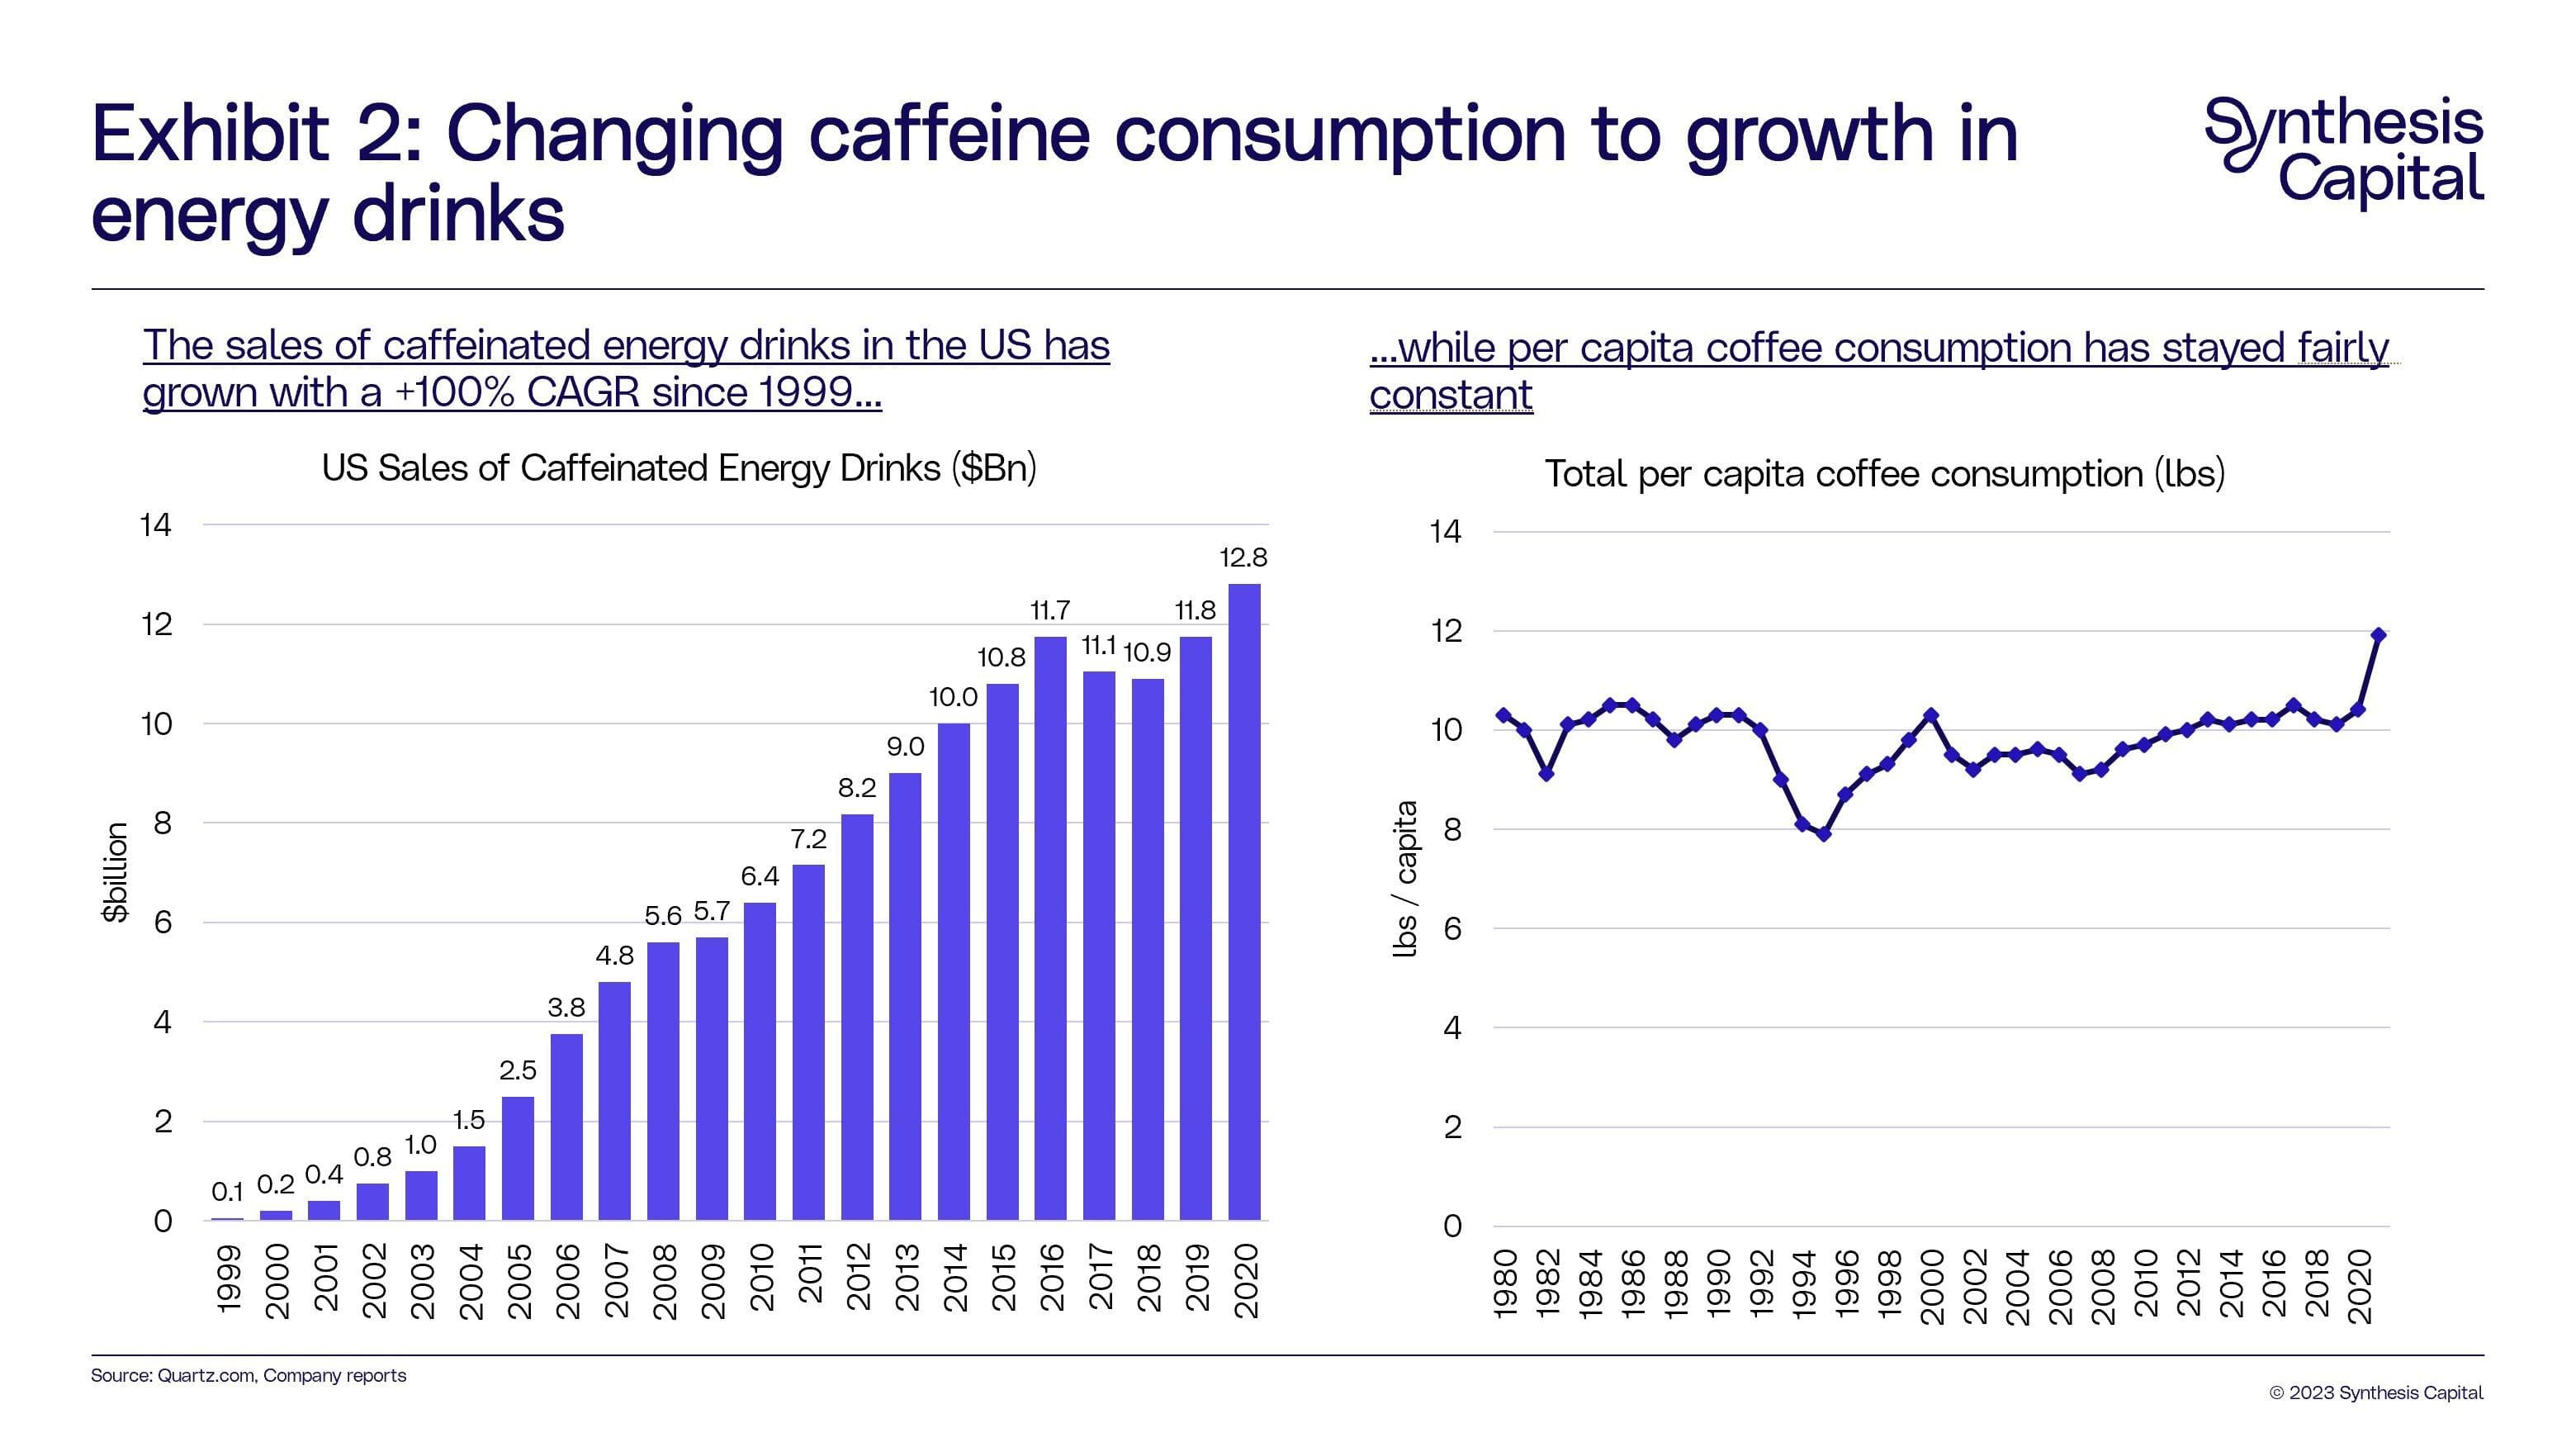
The advent of energy drinks illustrates the potential for entirely new forms of foods and beverages to be created. Energy drinks are a completely new class of drink – originating in Japan in 1962 with Lipovitan D which had extra caffeine and vitamins in and was marketed as a medicinal tonic – which has rocketed in the last 20 years. While the sales of sugary soft drinks has started declining in many countries, as consumers become more aware of the negative health impact of sugar, this has been replaced by increasing sales of energy drinks (caffeinated and un-caffeinated) in varied flavours and with broad branding approaches. In 2022 the market leader, Red Bull, sold over 11.5 billion cans globally, up from 4 billion in 2011[v].
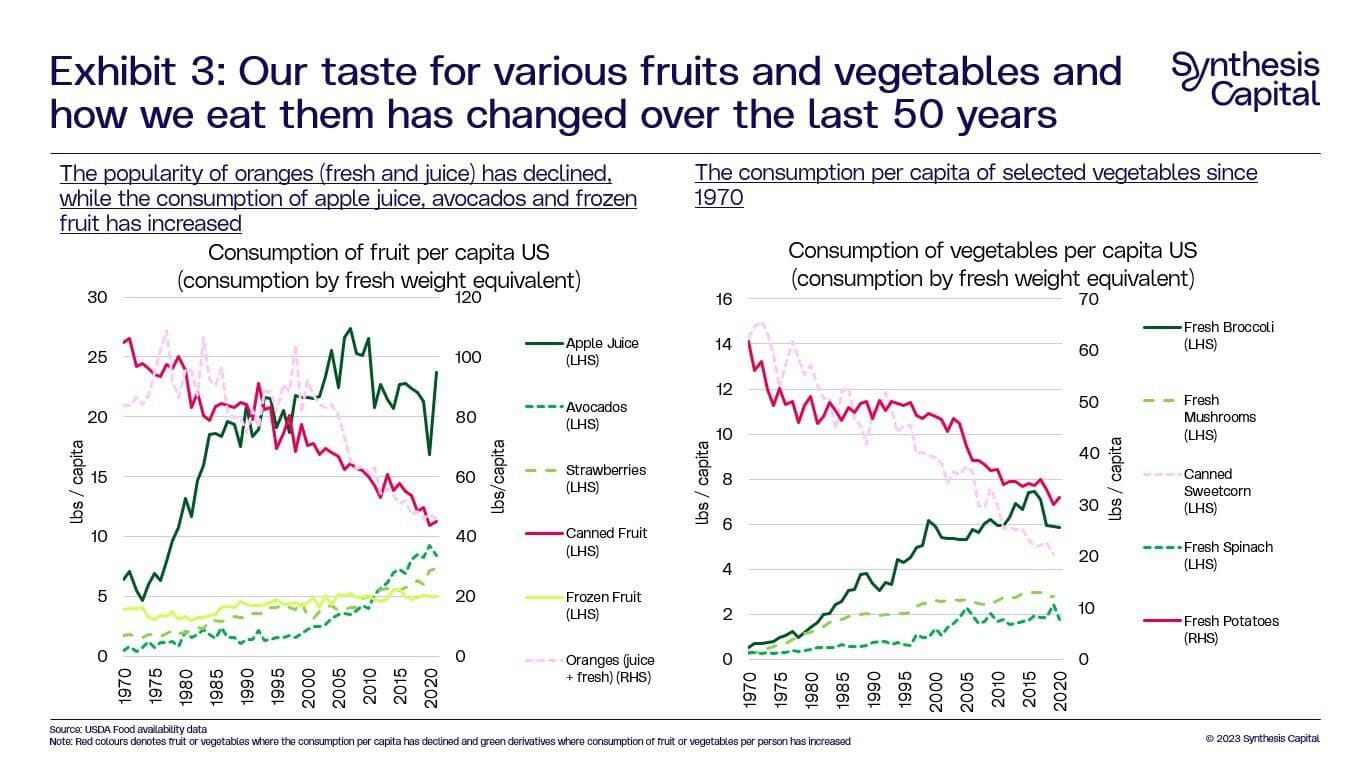
Analysis of fruit consumption in the US through USDA data shows that since 1970 while the amount of fruit consumed annually per person has stayed the same at 240 lbs per capita, the amount weighted towards fresh fruit has risen to 140 lbs per person in 2021 from about 100 lbs per person in 1970. While this shift is perhaps obvious, as the improvement in cold chain logistics and shipping has made fresh fruit and vegetables more accessible during this period, perhaps more interesting and unexpected are the changes to be found on an individual category level.
For example, oranges (both juiced and fresh) have fallen out of favour in the US with per capita consumption declining by half. USDA analysis highlights waning consumer demand as playing a role here, alongside decreased domestic orange production which also negatively impacted per capita availability, a proxy measure for consumption[vi]. Some of the decline in fresh oranges has been offset by an increase in consumption of other fresh citrus fruits like limes, tangerines and lemons, as well as other fresh fruit like strawberries, pineapples and avocados – which has seen a huge increase in popularity, growing by 18.7x since 1970.
These three US-focused case studies illustrate changing consumer preferences for certain products over time, however in reality they barely scratch the surface of what is possible with regard to changing food preferences. Consumers do not only change preferences around what they eat, but also around the way they engage with food, including how and where they purchase food. And, the dynamic nature of consumers is of course not limited to the US alone – changing consumer preferences is a global phenomenon, with the nature and extent of change being shaped by geography, cultural norms, government policy, and socio-economic status.
The dynamic nature of consumer preferences around food brings with it both opportunities and risks for the alternative protein sector, and innovative foods perhaps face a higher challenge versus other food categories. The assessment of consumers’ perceptions towards new foods will be important in the development and marketing of these products. However, as discussed in a prior Insights post “The Consumer and the S-Curve – How important is the Consumer?”, in the majority of settings consumer choice is tightly controlled by other forces, with, for example, retailers playing a significant role in shaping food choice.
Over the past decade, the alternative protein sector has evolved from a niche market towards a mainstream contender, with companies and investors capitalising on the financial opportunity posed by a dietary shift.
— The FAIRR Initiative
[i] The USDA has three distinct but related data series on food and nutrient availability for consumption: food availability data, loss-adjusted food availability data, and nutrient availability data. The data serve as proxies for actual consumption at the national level. The food availability data series serves as the foundation for the other two series. Loss-adjusted food availability data (LAFA) are derived from food availability data by adjusting for food spoilage, plate waste, and other losses to more closely approximate actual consumption. This second data series is considered preliminary because the underlying food loss assumptions and estimates require further improvement. For more information, please see the USDA website here: https://www.ers.usda.gov/data-...
[ii] For further history on the invention and ascent of Crisco, please see this Smithsonian summary here: https://www.smithsonianmag.com...
[iii] The History of Soap and Detergents by Mary Bellis. Accessible online here.
[iv] Diane C. Mitchell, Carol A. Knight, Jon Hockenberry, Robyn Teplansky, Terryl J. Hartman. Beverage caffeine intakes in the U.S., Food and Chemical Toxicology, 2014. Accessible here.
[v] https://www.redbull.com/gb-en/...
[vi] USDA ERS, Inflation-adjusted orange juice prices up 12 percent over 20 years, October 2023. Accessible online here.
This website uses strictly necessary cookies to enable the website to function, namely to secure our website and to save certain preferences and repeat visits, including recording your cookies preferences.
If you agree, we would also like to use non-essential cookies to enable us to observe traffic levels to the website which allows us to understand interaction with the website and helps us to improve the website and our services.
To learn more about this, visit our Cookie Policy. You may consent or decline to the use of non-essential cookies by clicking “Accept Cookies” or “Decline Cookies” below.