
The 5 Most Exciting Current Food Tech Trends
Opinion
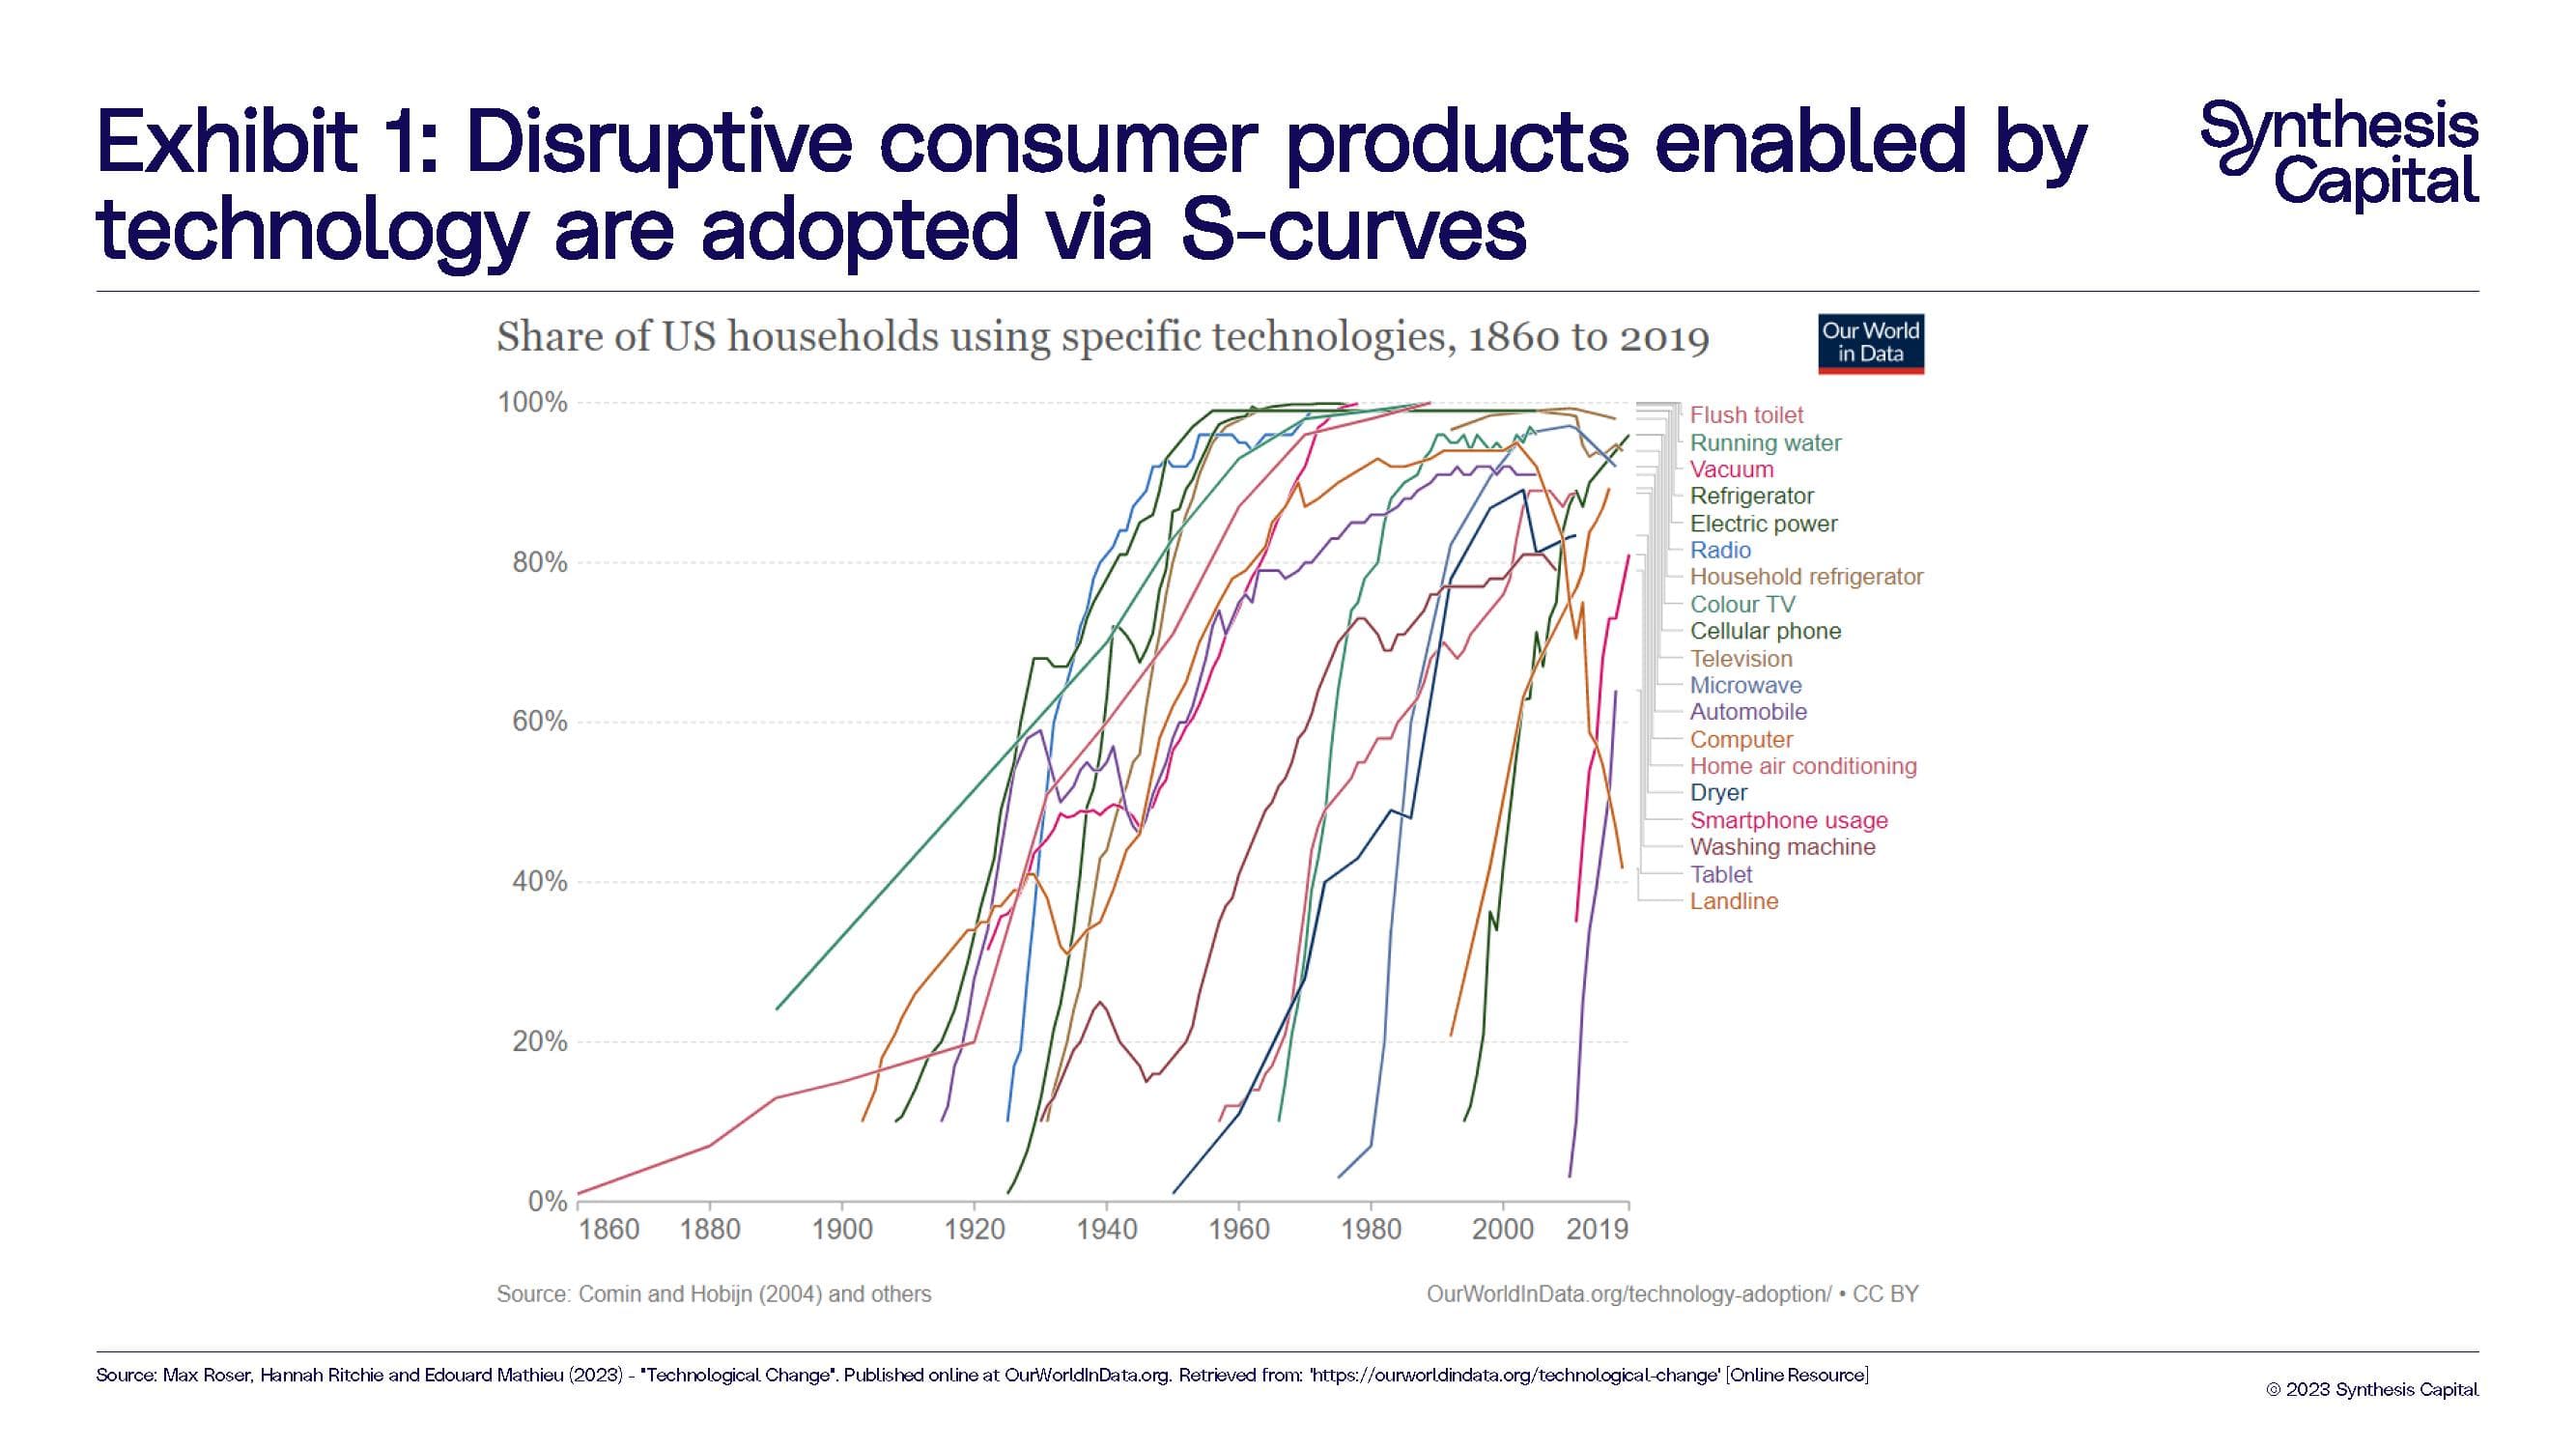
One question we frequently get asked is whether S-curve adoption happens in food. We get it – many of the examples we give are not necessarily food based, but are focused on other consumer products. For example, the chart in Exhibit 1 is from Our World in Data which has a whole section dedicated to technological change.[i] While some like to think that it should be different, we argue that food is not immune to technological disruption – and the pattern of that technology adoption is S-curve in shape.
The key word above is technology. It is the technological convergence that results in disruptive products, businesses and services. In the case of the consumer products above, we tend to focus on the products as being the source of the disruption, whereas we think more focus needs to be on the technology behind them as enabling the products, businesses and services that are disruptive.
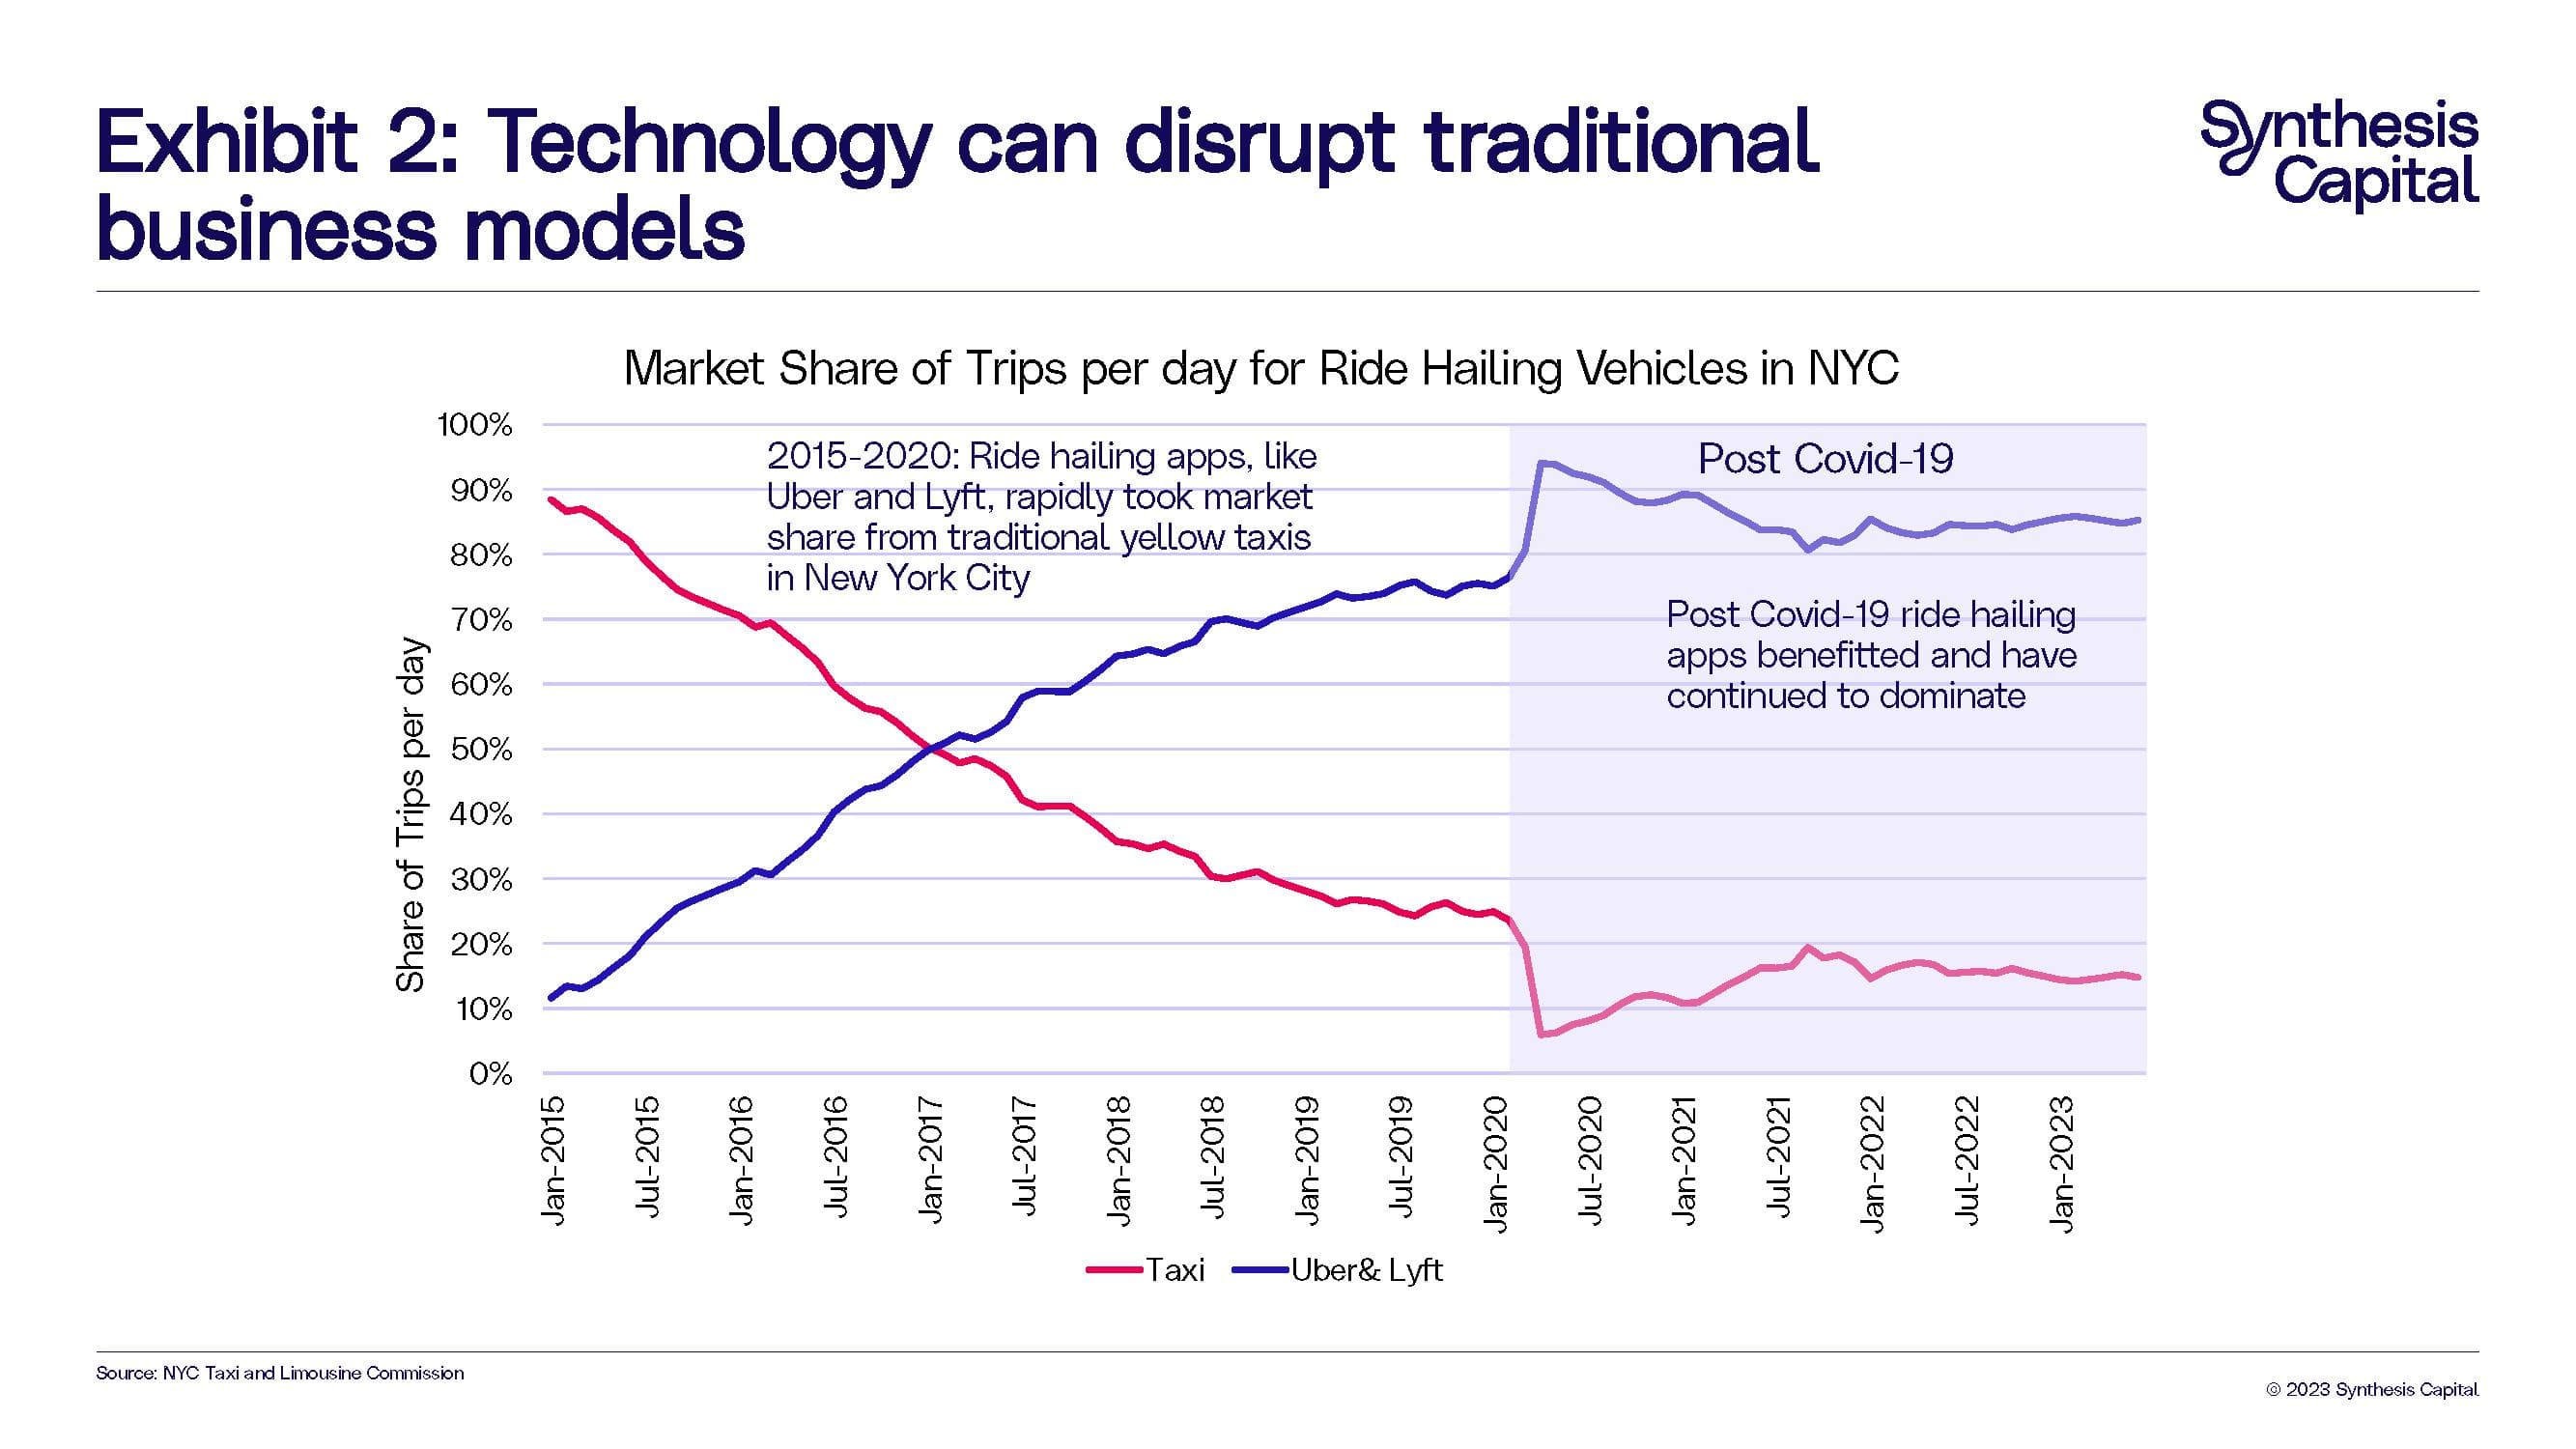
A simple example of this is the adoption of the use of ride-hailing apps like Uber and Lyft. Exhibit 2 shows how these apps have disrupted more ‘traditional’ taxi services in New York City over the last 10 years. Enabled by smartphones (another disruptive product itself enabled by technological convergence), the shift to ride-hailing apps was a rapid business model disruption not a product focused one.
Of course we are not diminishing the impact of consumer product based disruptions. However, acknowledging the role of improving technology in these disruptions is important when thinking about future disruptions. So everything from products, to manufacturing techniques, businesses, and services can all be disrupted. At Synthesis, this is important as we consider the growth in alternative proteins – and we move beyond just the products themselves into processes and manufacturing.
Even within food, many of the disruptive technologies we are investing in – precision fermentation and cultivated meat are very much disrupting the process not the product. The easiest way to think about this is considering that these are disrupting how the ingredient is made rather than the ingredient itself.
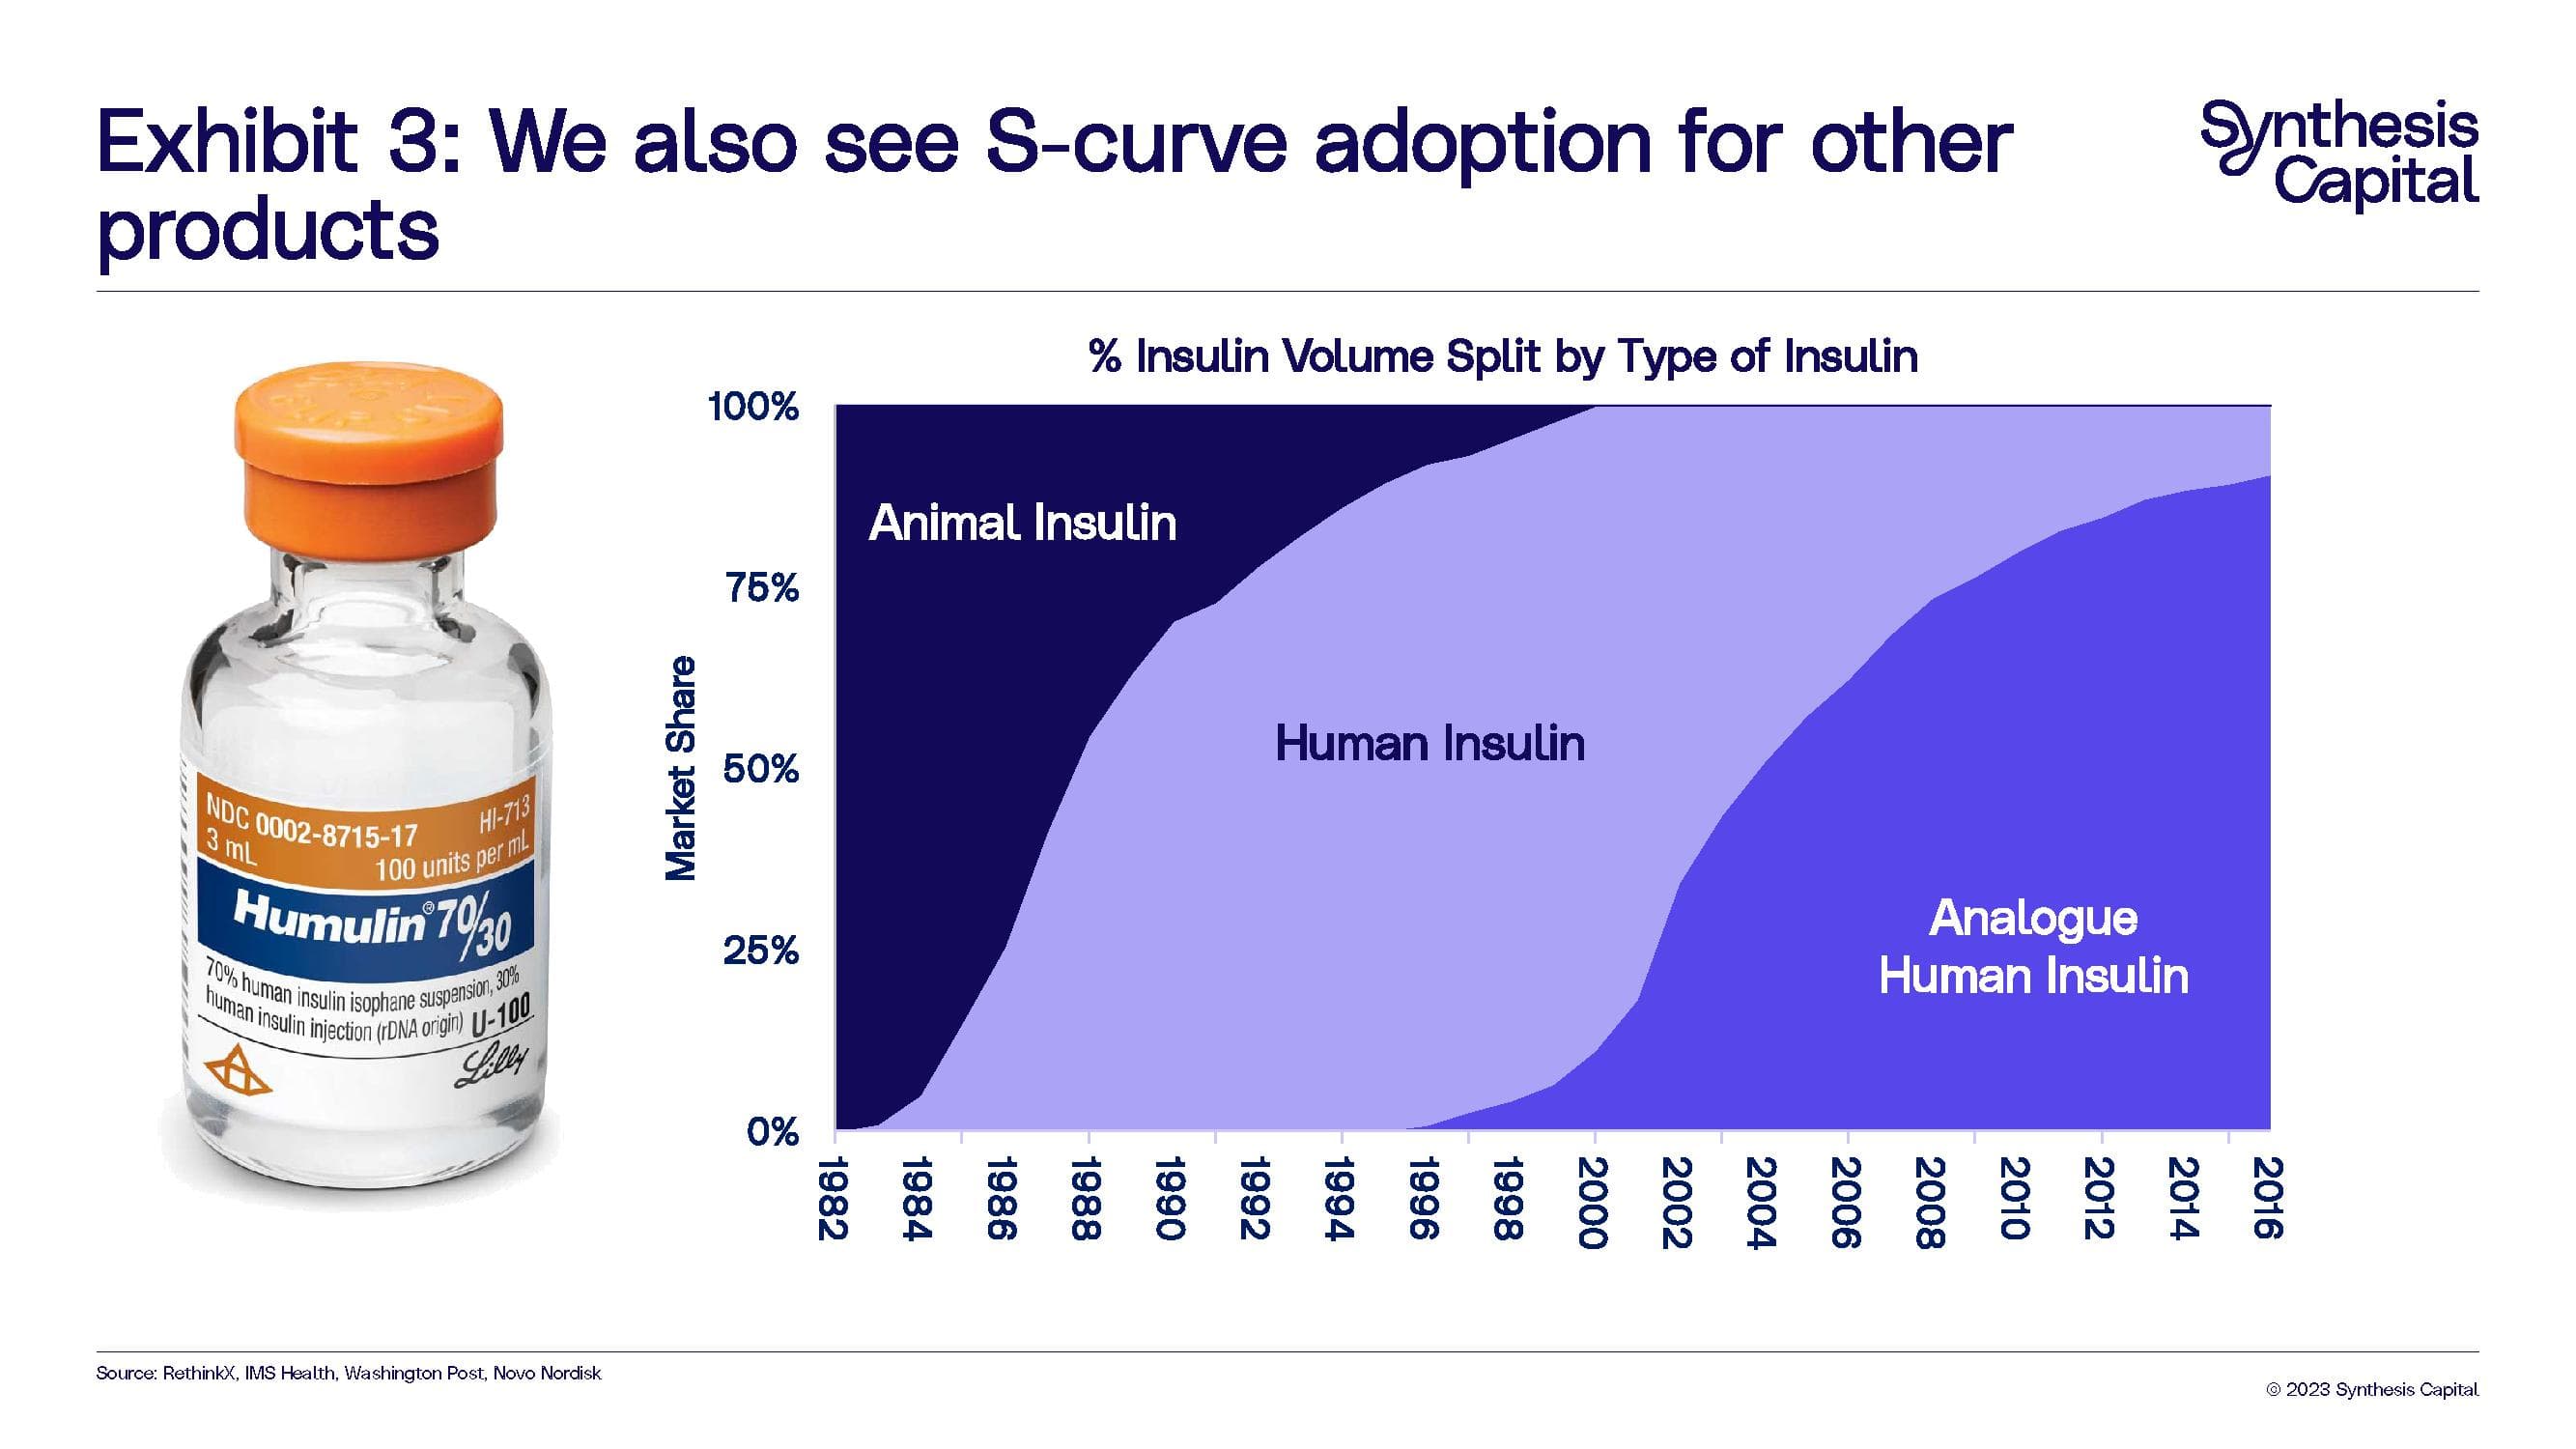
The S-curve we most often show in our presentations is the disruption case for animal insulin by human insulin, which was the first example of a protein produced commercially via precision fermentation (also known as recombinant protein production) (Exhibit 3). There are a couple of reasons for this. First, it shows how we have already disrupted animal derived products before – with the adoption following an S-curve. Second, it shows that disruptors can themselves be disrupted, with Humulin being replaced by new analogue insulins offering further improvements on the human insulin molecule to more closely mimic the behaviour of insulin produced in patients without diabetes, improving control of the disease and reducing complications in diabetics. Indeed the story of insulin is a great case-study for technology disruption; technological convergence allowed human insulin to be produced by precision fermentation; its cost, while initially more expensive, offered improved capabilities. As costs came down, disruption was rapid and followed an S-curve.[ii]
There are also other examples of these type of direct substitution disruptions in food – by this we mean when the exact same ingredient is produced in a novel way. This can directly be used in the food industry with little to no disruption to manufacturing processes allowing for a fairly easy “switch”.
Examples in the food industry include fermentation produced chymosin (FPC), the active ingredient of the enzyme rennet used in the production of cheese; citric acid, a staple used in the production of many types of food; and riboflavin, also known as Vitamin B2 (Exhibit 4).
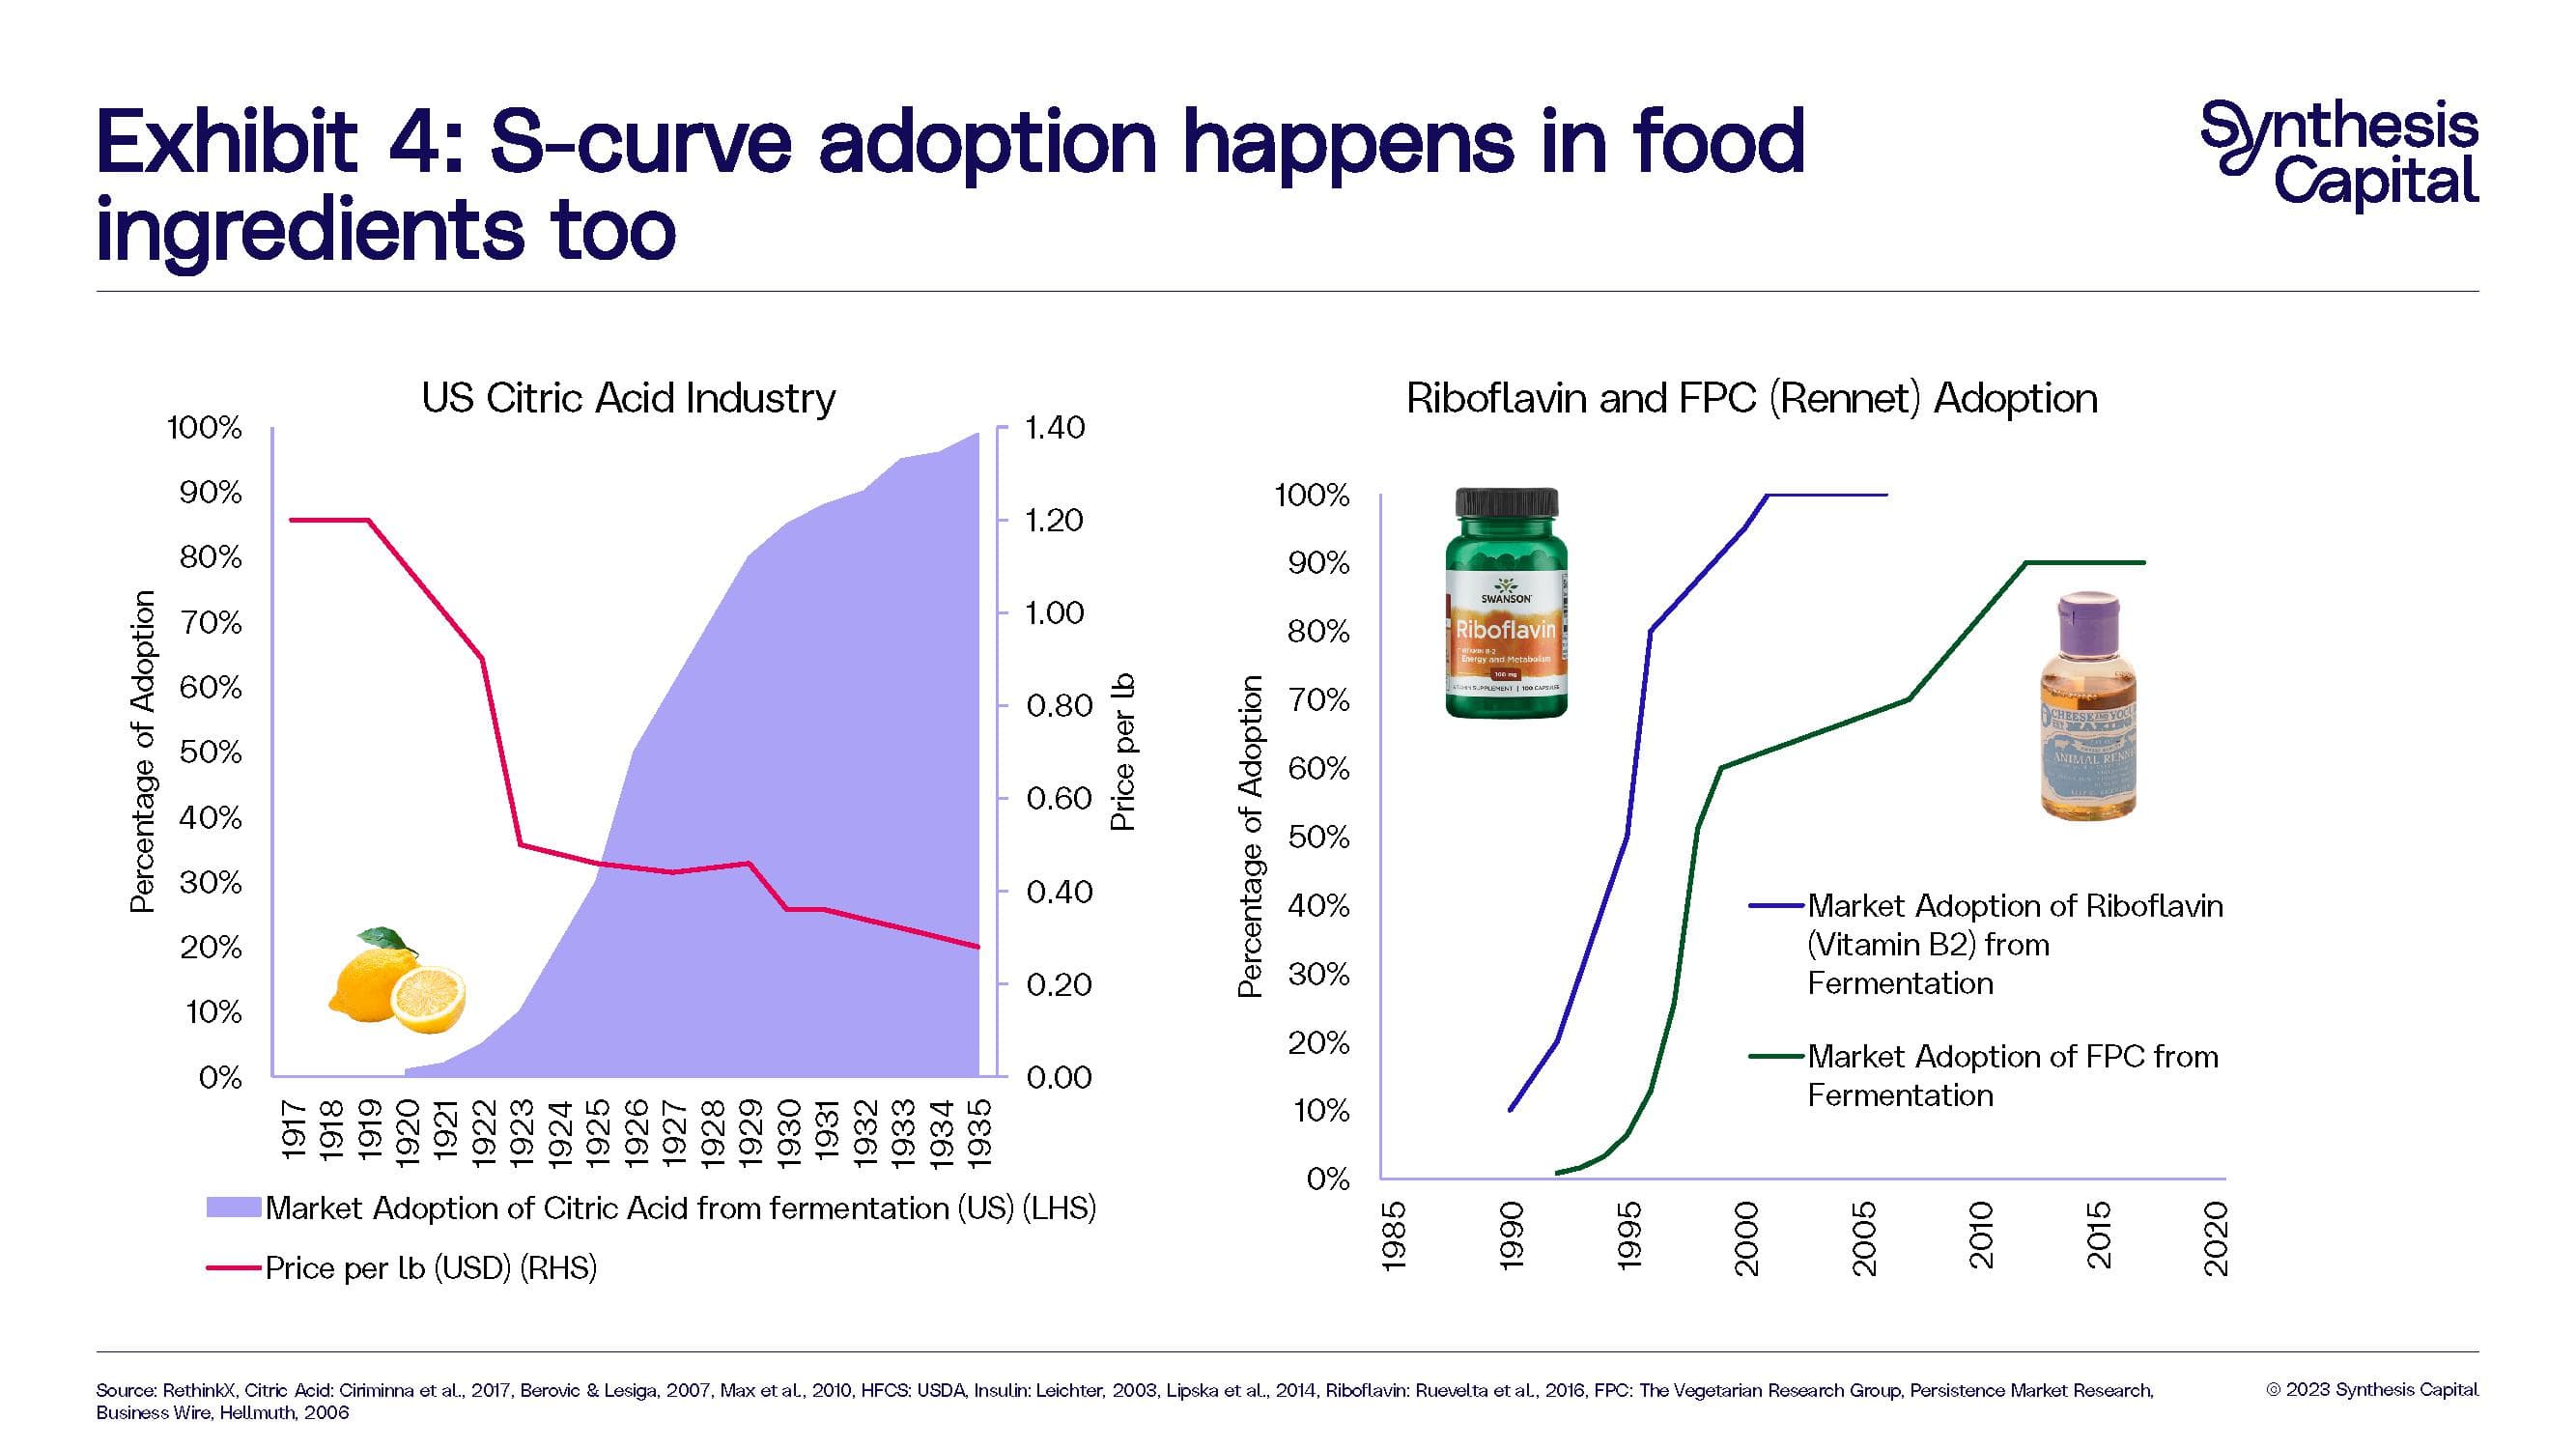
Citric acid is a particularly relevant comparison. Citric acid is a naturally occurring molecule found most concentrated in citrus fruit – it is what gives them their tart, sour taste. Today, citric acid is a commodity chemical consumed used as an additive in food, cleaning agents, cosmetics and nutritional supplements throughout the world.
Through the 19th century, citric acid was produced on an industrial scale by extracting it mainly from lemons. Efficiency wise, this process was not great – lemons are only made up of 9% citric acid – so making a single kilogram of citric acid requires more than 500 fruit. However, on the back of citric acid’s growing popularity and peaking Italian lemon exports, technological convergence – in this case of the biological understanding of microorganisms and fermentation came to the forefront. This time, to produce citric acid without the citrus fruits. In 1926 with the first large scale fermentation plant opening, its production of citric acid accounted for more than 50% of the global citric acid supply. By 1930 Pfizer no longer used citrus fruit for its citric acid production. [iii] Not that consumers ever knew it. This was a rapid ingredient-led substitution disruption.
Today, the citric acid market size is around 2.8 million tonnes, which would equate to about 900 trillion lemons. To put this into perspective, to produce this amount of citric acid from lemons would require more than 40,000x the number of lemons produced globally in 2021.[iv] Today’s citric acid market – and the foods that are available to us with it – would be simply unable to exist without technological innovation and disruption.
To produce the amount of citric acid used globally today just from lemons would require more than 40,000x the number of lemons produced in 2021 in the world.
Other examples of S-curve adoptions in food exist where the disruptive product is not exactly the same as the one it is replacing, but it does offer a substitution with a number of benefits across cost and performance (either through usability or flavour and texture wise) to the incumbent product.
There have been two fairly high profile examples of this in history both in the US – the switch from sugar to corn based sweeteners and from butter to margarine. Notably, both have seen some switching back in recent times due to some nutritional and health impacts.
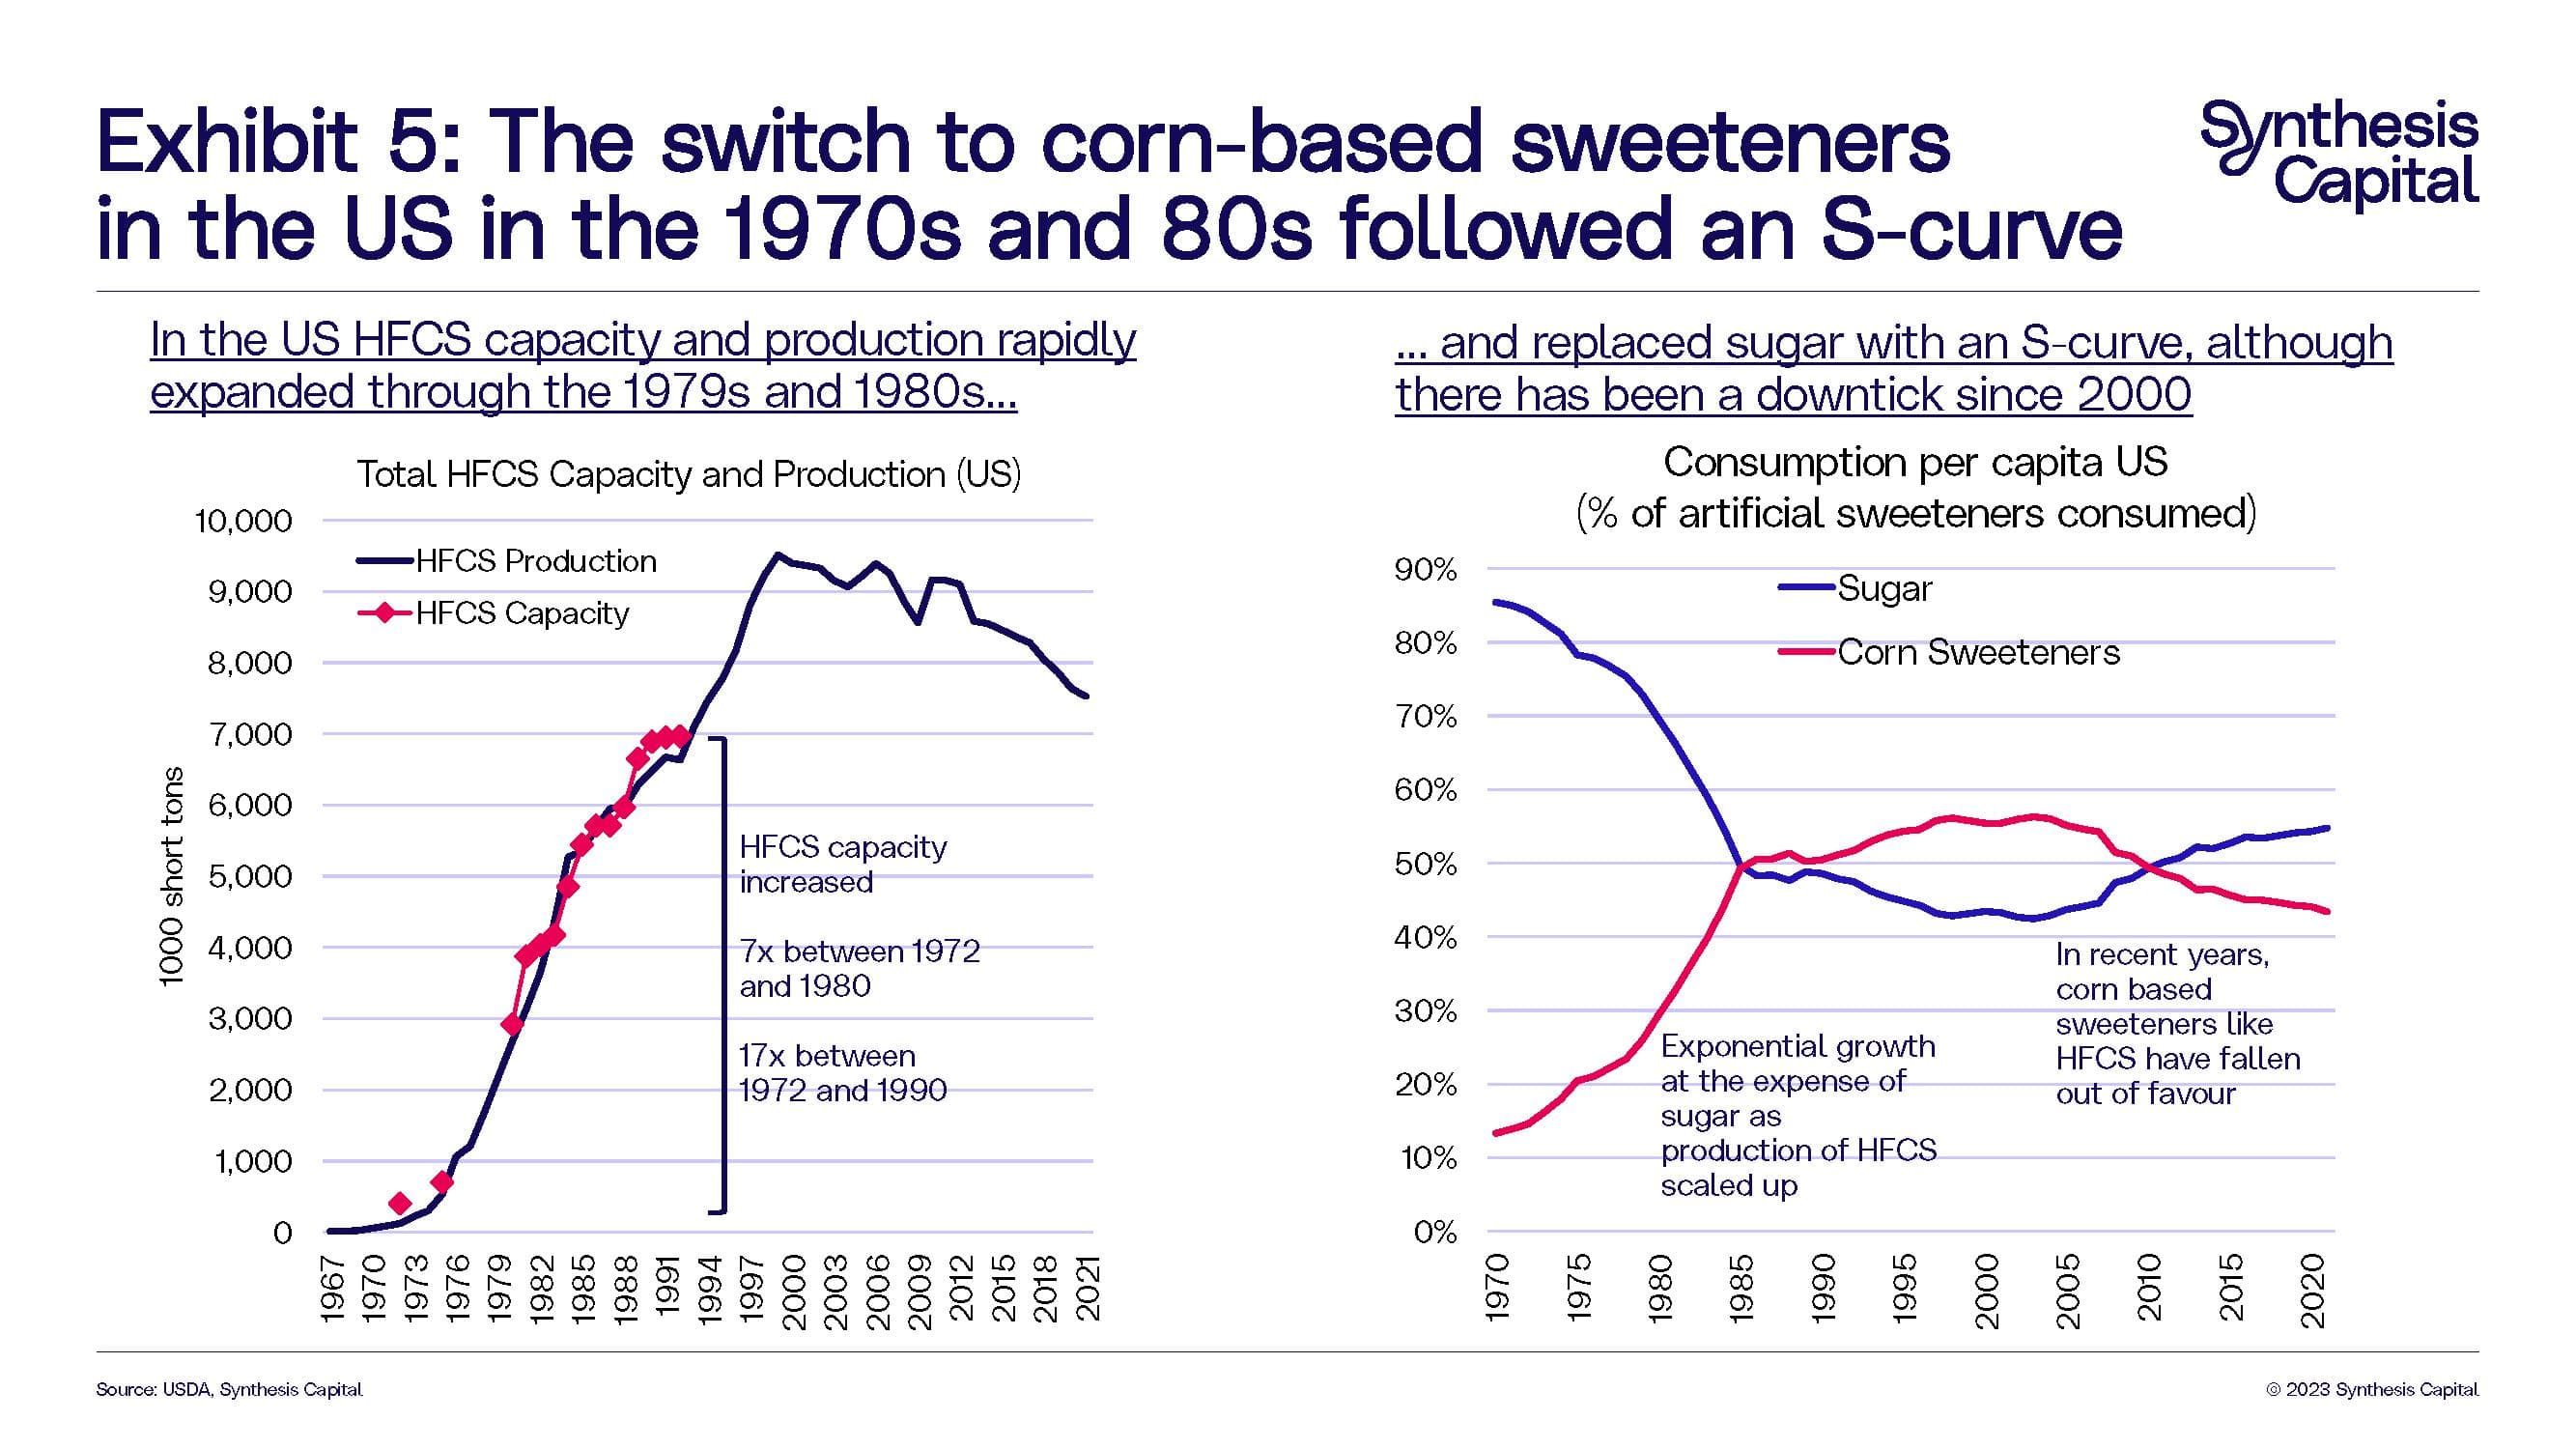
We discussed the switch to corn based sweeteners in our insights piece “Feeding Our Future Food System: Can We Scale Glucose Production?” The production and subsequent growth in high fructose corn syrup (HFCS) (the main sweetener made from corn in the U.S.) came about due to breakthroughs in enzyme technology and marked a step change from traditional corn syrup. Supported heavily by the large US corn processors, who had rapidly built capacity in response to high sugar prices, adoption of corn based sweeteners was rapid – following an S-curve. The growth in HFCS capacity, production and importantly consumption took off as a result, with U.S HFCS capacity growing by over 7x between 1972 and 1980 and by over 17x between 1972 and 1990 (Exhibit 5). More recently, corn based sweeteners have come under pressure, due to health concerns, resulting in some of the biggest companies in the US (Coke, PepsiCo, Pizza Hut, KraftHeinz amongst other) making the switch from HFCS back to a “natural” blend of cane and beet sugars.[v]
While butter stretches back to pre-history[vi], margarine has its origins in Napoleonic times, when Emperor Napoleon III of France offered a prize to anyone who could produce a cheap butter alternative for use by the armed forces and lower classes. This first process combined animal fat and skimmed milk – and some yellow food colouring. However, today margarine is a pretty heterogenous term, and generally refers to any butter substitute made from a mix or otherwise of vegetable, animal or dairy fats.
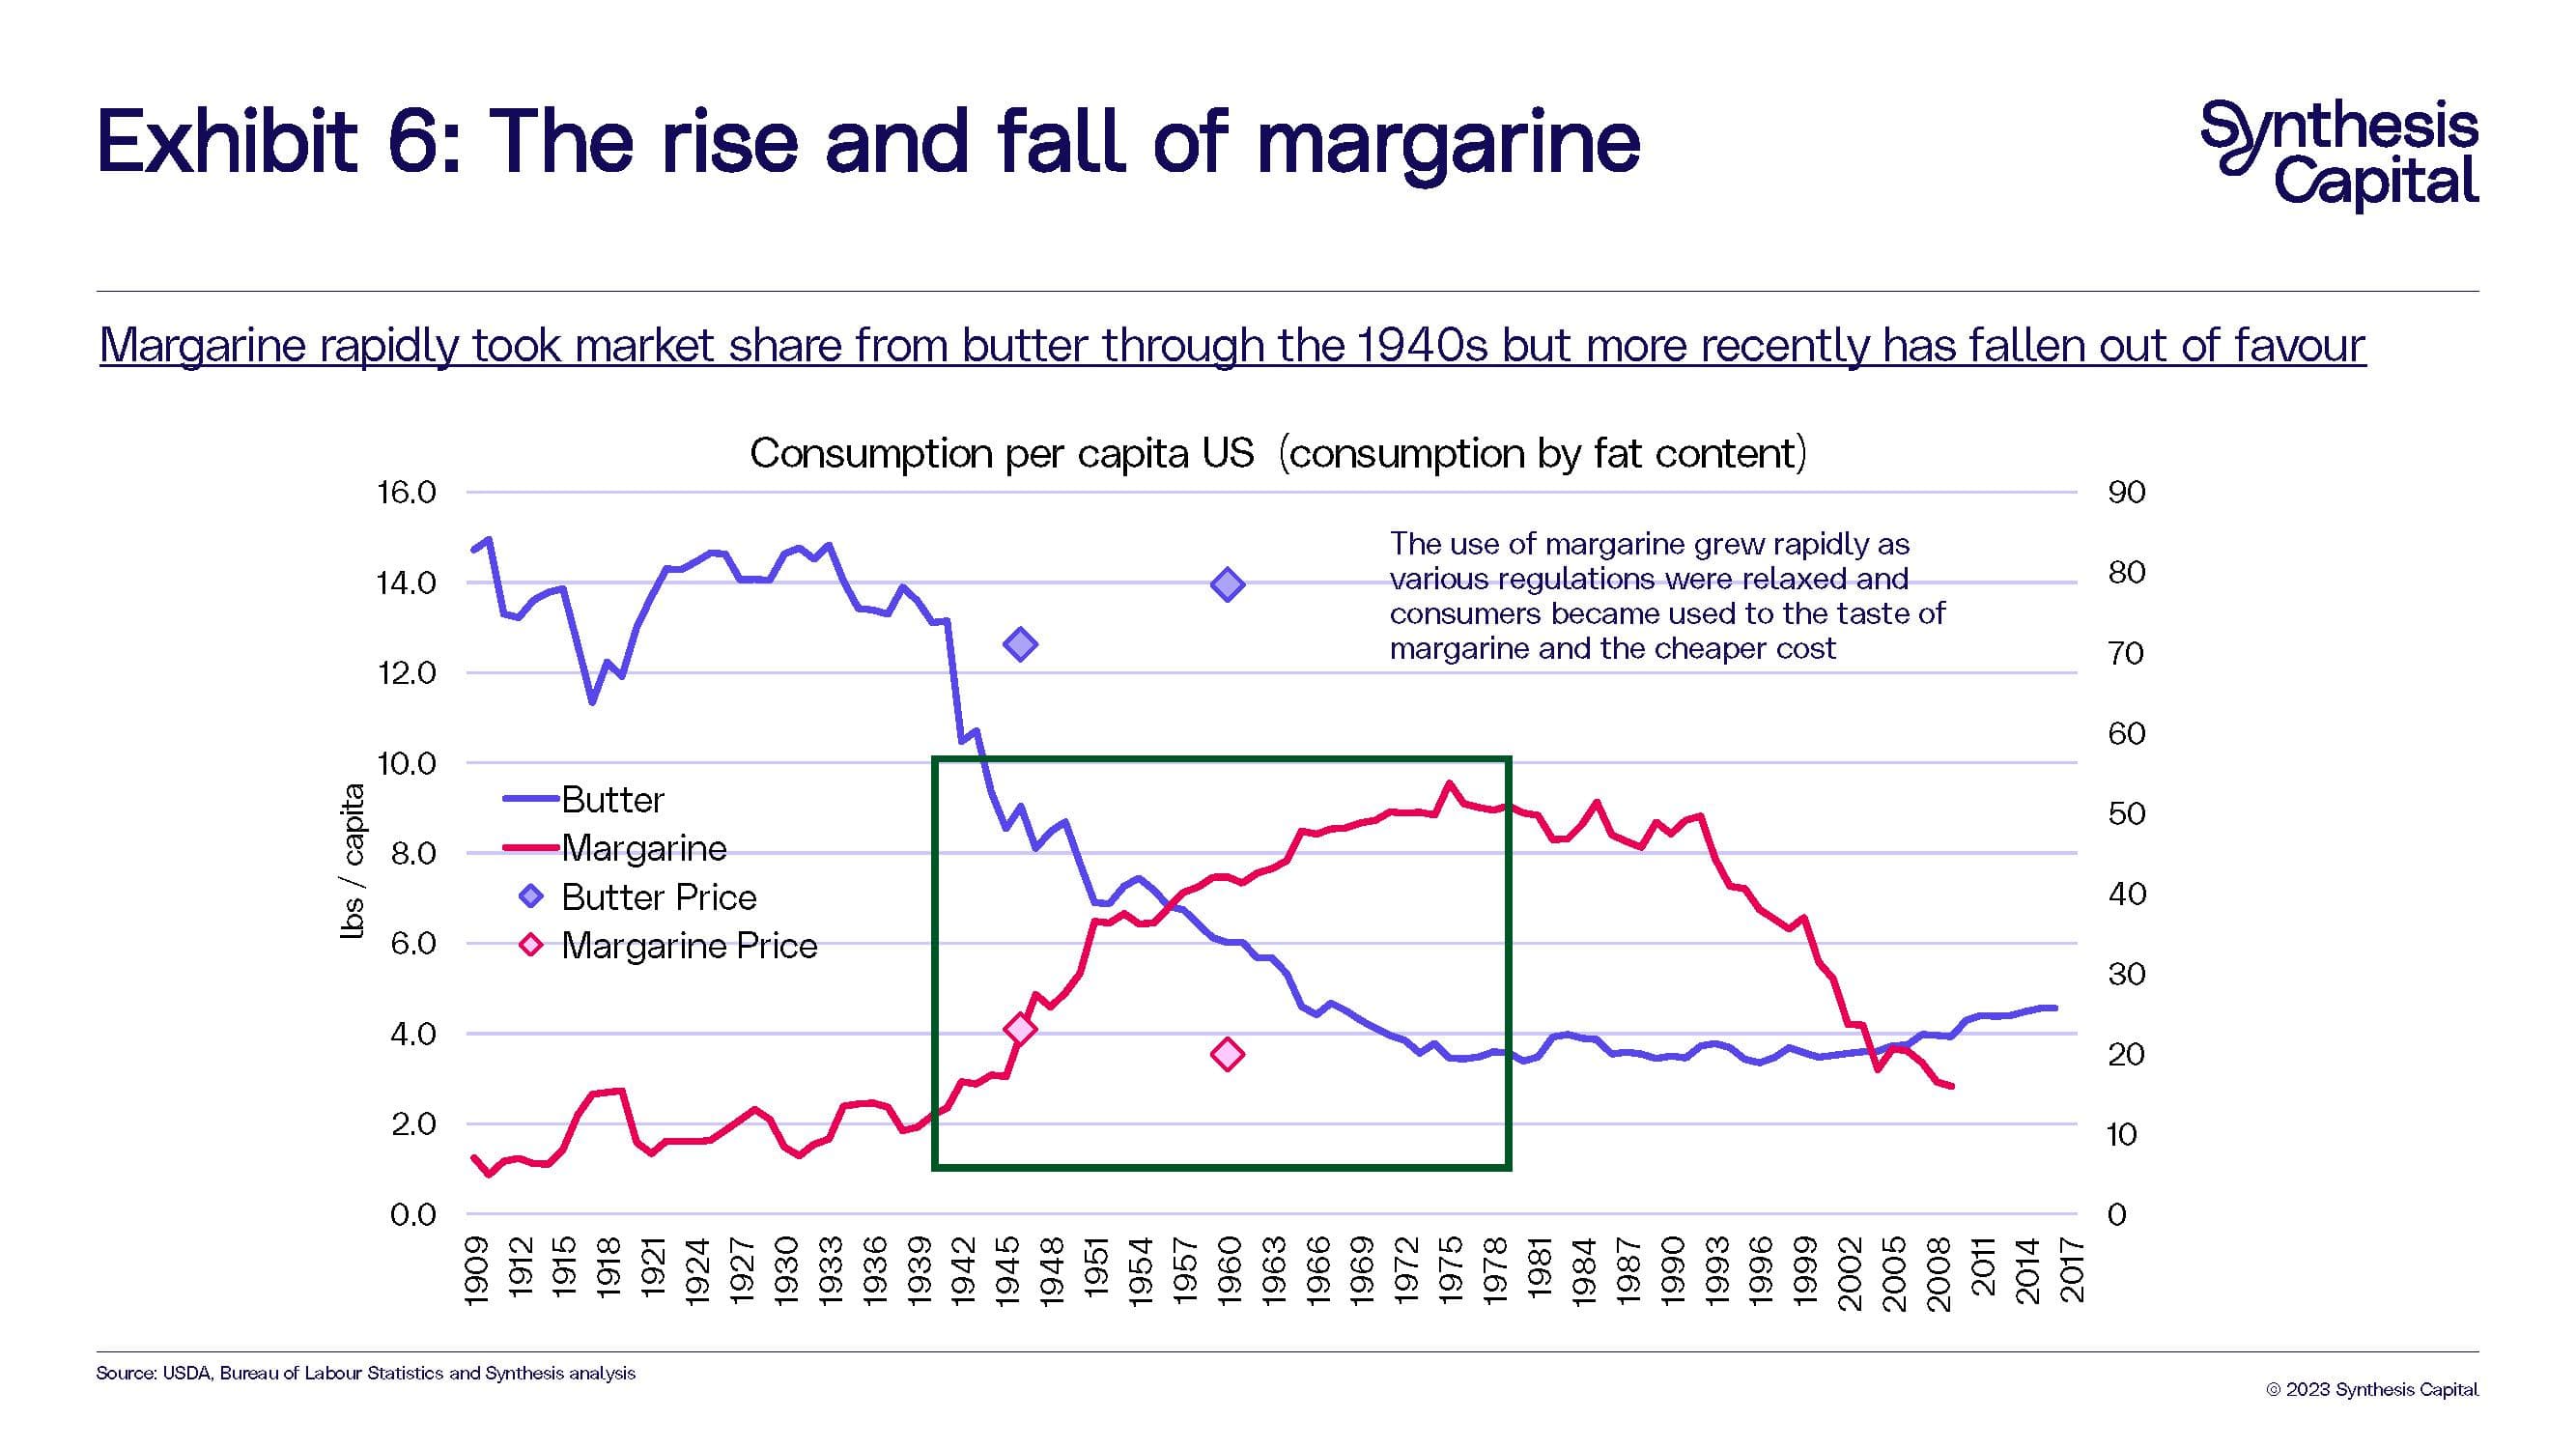
In the US, the history of the rise (and fall) of margarine consumption is interwoven with that of butter. Margarine was first introduced in 1875, but just ten years later, due to the threatened dairy industry, 24 states had restricted its production, sale and use – and the 1886 federal Oleomargarine Act imposed further taxes. For a long period of time margarine was considered contraband in many states in the US.[vii] Incredibly this law wasn’t overturned until 1950, mainly driven by wartime shortages and rationing, the Great Depression, and a growing supply of vegetable oils (specifically soybean) – which due to the invention of hydrogenation, meant that by the 1930s margarine were primarily made from vegetable oils.[viii]
In 1910, when the USDA data begins (Exhibit 6), butter was the preferred fat in the US. The production of margarine in the US was restricted a that time. You can see margarine gains popularity – and consumption grows in an S-curve – through the war and after the subsequent relaxing of early public policies and restrictions on margarine.
Since then, margarine has gone through more ups and downs – often health linked. In the 1960s the American Heart Association recommended replacing saturated fat (found more in animal fats like butter) with polyunsaturated fat (found in vegetable fats like margarine) to help cholesterol – leading to margarine being favoured over butter. However, in the 1990s it was revealed that trans-polyunsaturated fats were seriously bad for human health. This led to a number of food agencies globally banning “trans-fats”.[ix]
Today, margarines have been reformulated to take out trans fats, but the ball is firmly back in butter’s court.
So history shows us that technologies have disrupted food in the past – and these adoptions follow an S-curve. Some of these disruptions have happened in a way that has simply been undetectable by the consumer. Others have been directly linked to the consumer, and often by them choosing cheaper products.
In Part 2, we will look at how consumer food preferences have changed over history.
[i] Max Roser, Hannah Ritchie and Edouard Mathieu (2023) - "Technological Change". Published online at OurWorldInData.org. Retrieved from: 'Our World in Data' [Online Resource]
[ii] RethinkX. The Disruption of Insulin – The First Product from Precision Fermentation.
[iii] RethinkX. The Fermentation Led Disruption of Citric Acid.
[iv] In 2022, according to this source, 2.8 million mt of citric acid was produced globally. According to this paper: Molinari, Ettore, “Treatise on General and Industrial Chemistry,” 2nd ed., Part I, pp. 412-19, London, J. and A. Churchill, 1920. 100,000 lemons are required to produce 300kg of citric acid. Therefore, 2.8 million tonnes of citric acid equates to 933 trillion lemons. In 2021, according to FAO 20.8 million tonnes of lemons were produced, assuming 10 lemons per kg this is 20.8 billion lemons. 933 trillion / 20.8 billion is 44,782x. A number the “natural” source of citric acid could not hope to keep pace with.
[v] Slate. Dark Sugar: The decline and fall of high-fructose corn syrup. Link here. (accessed October 2023)
[vi] Or even Neolithic times – from Elaine Khosrova’s book Butter: A Rich History
[vii] When Margarine was Contraband. Accessed here.
[viii] Butter and Margarine Availability over the last century. USDA. July 2016. Accessed here.
[ix] Butter vs. Margarine. November 2017. Linked found here.
This website uses strictly necessary cookies to enable the website to function, namely to secure our website and to save certain preferences and repeat visits, including recording your cookies preferences.
If you agree, we would also like to use non-essential cookies to enable us to observe traffic levels to the website which allows us to understand interaction with the website and helps us to improve the website and our services.
To learn more about this, visit our Cookie Policy. You may consent or decline to the use of non-essential cookies by clicking “Accept Cookies” or “Decline Cookies” below.